
Author

Context within the IPBES
The Section I, Chapter 5 focuses on scenario modelling and forecasting in Integrated Assessment Models (IAM). These models are especially relevant for projecting environmental, economic, and social scenarios incorporating both quantitative and qualitative. As stated by the Intergovernmental Science-Policy Platform on Biodiversity and Ecosystem Services (IPBES), it is important to address uncertainty in models and discuss the used methods under different policy, technological, or societal change scenarios (O’Brien, 2024). Moreover, understanding how changes in hydropower generation interlink with broader water resource management, energy security, and climate change impacts across scales will strengthen decision-making and policy development. A schematic illustrating these interlinkages can further enhance the integrative approach of the IPBES Assessment and highlight the interconnectedness of these systems.
It is helpful to apply the IPBES guidelines in scenario modelling, and in the following a study on climate impact on hydropower generation within West Africa will be outlined and explained to bring it to a wider audience (Salomon Obahoundje, 2022).
Problem Statement
Climate Change is threatening the predictability of hydropower generation. This is driven by stronger extremes between years, but also stronger seasonality in wet and dry seasons (Obahoundje, 2022). The effect on hydropower is multifaceted. On one side it can increase output during wet seasons. On the other side, it also extends seasons where hydropower is barely usable.

Hydropower is deeply connected with the water–energy–food–health–climate nexus and for example can affect food security. Due to that it is relevant to analyse the effects on hydropower and its efficiency.
Objectives
The paper on “Modelling climate change impact on inflow and hydropower generation of Nagbeto dam in West Africa using multi-model CORDEX ensemble and ensemble machine learning” is assessing the impacts of climate change on reservoir and hydropower generation (Salomon Obahoundje, 2022). It analysed periods up to 2100 under two Representative Concentration Pathways (RCP) 4.5 and RCP8.5 (H.-O. Pörtner, 2019). The RCP4.5 represents an intermediate scenario where emissions peak around 2040, while in the RCP8.5 emission continue throughout the 21st century. RCP8.5 is the worst-case climate scenario.
In the Methodology section the used approach within the mentioned paper will be explained in lay terms, followed by their results. In the Discussion a brief analysis of the results will be given and summarised in the Conclusion.
Methodology

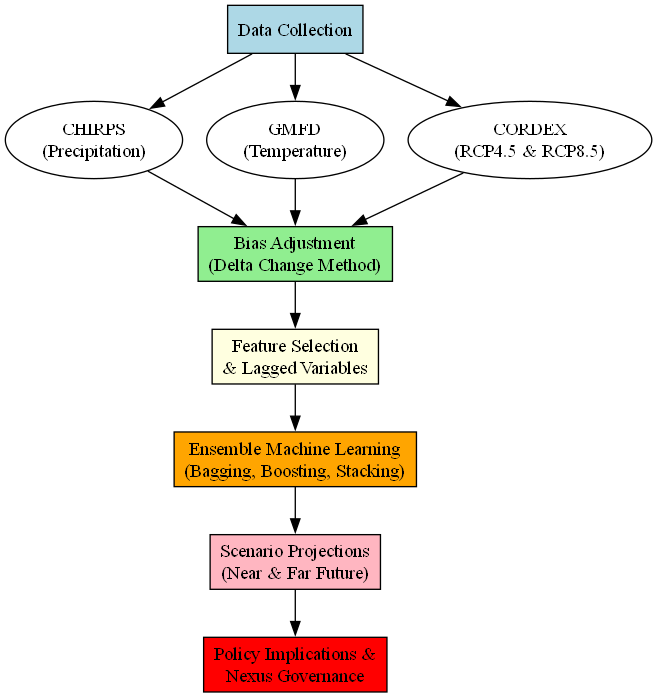
The study by Obahoundje et al. (2022) on the impacts of climate change on the inflow and generation of hydropower at the Nangbeto dam in West Africa uses a sophisticated approach to analyse future climate scenarios and their potential effects on hydropower. Figure 1 gives an overview of the methodology employed.
Data Collection and Sources
As a first step, climate data was gathered, which included information on precipitation and air temperature. This was sourced from several key datasets:
- CHIRPS (Climate Hazard Group Infrared Precipitation with Stations): This provides high-resolution daily precipitation data (about 5 km by 5 km grid size) from 1988 to 2016, which is crucial for understanding rainfall patterns.
- GMFD (Global Meteorological Forcing Dataset): This data set provides air temperature data with a coarser resolution of 28 km by 28 km, covering the same 1988 to 2016 period.
In addition, they used CORDEX (Coordinated Regional Climate Downscaling Experiment) data, which provides detailed climate projections for different regions of the world. These projections span from 1980 to 2099 and include future climate scenarios under two possible pathways: RCP4.5 and RCP8.5. The CORDEX data were adjusted to correct for bias using the CHIRPS and GMFD datasets, ensuring more accurate modelling of future conditions.
Bias Adjustment
To ensure that the CORDEX data were more reliable, the researchers applied a bias adjustment process. This method compares the historical data from CHIRPS and GMFD with the climate model outputs from CORDEX, adjusting for any discrepancies. The adjustment is performed using a technique called the delta change method, which modifies the historical data based on the observed differences (delta) between model outputs and actual observations. While this method ensures that future projections reflect more realistic changes in precipitation and temperature, it is important to recognize the uncertainties inherent in the bias adjustment process.
The delta change method assumes that the bias between observed and model data remains consistent over time. However, this assumption introduces uncertainty because it may not hold true under shifting baseline conditions, such as significant changes in precipitation patterns or temperature variability. Although the approach is commonly used and practical, its accuracy depends on the stability of these biases. Future work should explicitly assess this assumption by conducting a formal sensitivity analysis. Such an analysis would enhance understanding of how different baseline conditions might influence bias adjustments and, consequently, future climate projections.
This uncertainty is an essential consideration, as the IPBES emphasizes the importance of addressing uncertainty in environmental modelling to enhance transparency and the credibility of projections. While the delta change method offers a practical approach to bias correction, future research should explore additional techniques, such as quantile mapping or empirical-statistical downscaling, to further refine the adjustments and reduce uncertainty in model projections.
Climate Models Used
The study relied on an ensemble of multiple climate models to improve the accuracy and reliability of their projections. Specifically, they used:
- Three Global Circulation Models (GCMs): These are large-scale models that simulate global climate patterns.
- Six Regional Climate Models (RCMs): These focus on smaller, more localized regions (like West Africa in this case) and provide more detailed climate projections.
By averaging the outputs of all these models, the researchers aimed to create a more robust projection of future climate conditions. This is called an ensemble mean, and it is often preferred over relying on a single model, as it accounts for uncertainties and improves the reliability of the results.
Data for Hydropower Generation
To model hydropower generation, the researchers used actual data on energy input and flow from the Mono River Authority for input and CEB (Compagnie d’Électricité du Bénin) for energy generation. These data sets covered the period from 1988 to 2017 and were used to calibrate the models, ensuring that the simulated results matched the real-world data as closely as possible.
Machine Learning for Prediction
The core of the methodology involves using ensemble machine learning methods to predict how climate change will impact the flow and generation of hydropower at the Nangbeto dam. The researchers used a combination of different machine learning algorithms, including:
- Bagging: A technique that reduces the variance in predictions by using multiple models and averaging their outputs.
- Boosting: A method that focusses on improving the accuracy of weak models by sequentially correcting errors made by previous models.
- Stacking: This involves combining the predictions of multiple models to create a stronger overall prediction.
The use of ensemble machine learning techniques, including bagging, boosting, and stacking, offers a robust framework for forecasting hydropower generation and inflow. However, to further enhance the methodological rigor, it is essential to discuss the feature selection process and how lagged variables are weighted within the ensemble model.
Feature Selection Process
Feature selection is critical in reducing overfitting and improving the model’s ability to generalize. In this study, the model relies on a set of key climate predictors: precipitation and temperature, along with their lagged values over the past 1 to 12 months. These features were carefully selected based on their known impact on hydropower generation, ensuring that the most relevant predictors are included. The selection process was guided by both statistical methods and domain knowledge, which helped prioritize features with high correlation to the target variables, inflow and energy generation.
Weighting of Lagged Variables
The lagged variables are weighted based on their temporal relevance to hydropower generation. For example, recent precipitation (1–3 months prior) has a stronger effect on inflow than precipitation from earlier months. The ensemble method adjusts the importance of these variables by evaluating their contribution to predictive accuracy during model training. This dynamic weighting ensures that the model adapts to changing temporal patterns in climate data.
Uncertainty Range (Ensemble Spread)
A key component of the IPBES guidelines is addressing model uncertainty. In this study, the ensemble spread—the range of outputs from the different models in the ensemble—was analysed to assess the uncertainty in the final projections. By incorporating multiple climate models and machine learning algorithms, it captures a range of possible future scenarios. The spread of projections allows for a better understanding of the variability in the results, highlighting the uncertainty inherent in future climate change projections. This uncertainty range is essential for decision-making, as it provides policymakers with an understanding of the potential risks and helps in planning for a range of possible future conditions.
Validation and Performance Metrics
To ensure the reliability of the machine learning models, the researchers used K-fold cross-validation. This method divides the available data into several subsets and trains the model on different combinations of these subsets, which helps prevent overfitting1. The performance of the models was evaluated using several metrics, such as:
- Root Mean Squared Error (RMSE): A measure of the difference between the predicted and observed values.
- Pearson’s correlation: A measure of how closely the predicted values match the observed data.
- Mean Absolute Error (MAE): Another measure of prediction accuracy, showing the average size of the errors.
Final Model Development
Once the machine learning models were trained and validated, the researchers combined the best-performing algorithms to create a final ensemble mean model. This model was then used to simulate future input and hydropower generation under the two climate change scenarios (RCP4.5 and RCP8.5) from 2021 to 2099.
Results
The effectiveness of the corrected climate data was analysed using several metrics, including bias, Pearson correlation, and normalized root mean square error (nRMSE). This bias-adjusted climate data, modified using the delta change method, demonstrated strong performance during both the calibration (2006–2011) and validation (2012–2016) periods. For instance, precipitation displayed an absolute bias below 20 mm, and temperature exhibited an absolute bias under 0.4 °C. These adjustments led to a high correlation coefficient (>0.85) between the adjusted and observed climate data. The nRMSE was found to be below 50% for both precipitation and temperature, indicating a good fit between the model’s adjusted data and the observed climatic variables. The monthly patterns of precipitation and temperature, both raw and adjusted, corresponded well with observed patterns during both calibration and validation periods, as depicted in Figure 2.
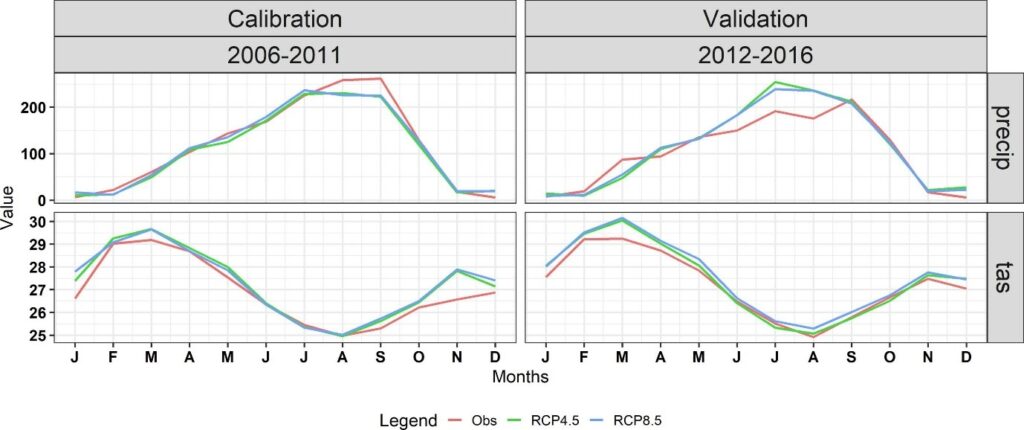
Figure 2 Comparison of monthly patterns of adjusted climate variables over calibration and validation periods (Salomon Obahoundje, 2022)
In relation to the target data set, simulations of hydroelectric generation and inflow to the Nangbeto dam utilized an ensemble machine learning model. The model’s performance was evaluated using R squared (R²), mean absolute error (MAE), and root mean square error (RMSE). Results indicated that the gradient boost machine (GBM) exhibited the best performance for energy generation (R² = 0.86, MAE = 15.76, RMSE = 22.88), while k-Nearest Neighbours (kNN) was most effective for inflow (R² = 0.86, MAE = 32.14, RMSE = 67.29). Building on these findings, the ensemble averages were constructed using GBM for energy predictions and kNN for input predictions. The comprehensive model that integrated these algorithms was subsequently validated over the period 1988–2017. For energy generation, the model achieved robust outcomes with an R² of 0.87, MAPE of 2.93%, and nRMSE of 48.90%. The model’s inflow performance was slightly lower, with an R² of 0.82, MAPE of 9.3%, and nRMSE of 58%. Nonetheless, the model maintained a strong correlation with the observed data for both energy generation and inflow.
Projected Climate Change over the Mono River Basin in West Africa
This research anticipates notable alterations in both precipitation and temperature for future periods (2020–2099) compared to the historical baseline (1986–2005), visible in Figure 3. Temperature is projected to rise significantly, with estimates ranging between 0.95°C and 2.33°C under RCP4.5, and from 1.09°C to 3.72°C under RCP8.5. These temperature increases are anticipated to manifest at both seasonal and monthly scales, showing consistent upward trends throughout the future periods. Similarly, precipitation is expected to increase under both RCP scenarios, although the pattern is less straightforward. For instance, during the early future period (2020-2029), precipitation is projected to rise modestly, with an increase of 0.22 mm/month under RCP4.5 and 4.55 mm/month under RCP8.5. The most substantial increases, however, are forecasted for 2060–2079, with a rise of 1.61 mm/month under RCP4.5 and 5.11 mm/month under RCP8.5. Notably, the expected rise in precipitation is statistically significant at the 99% confidence level, though the trend is not consistent throughout the year. Precipitation is projected to decrease between February and June, then increase from July to January.
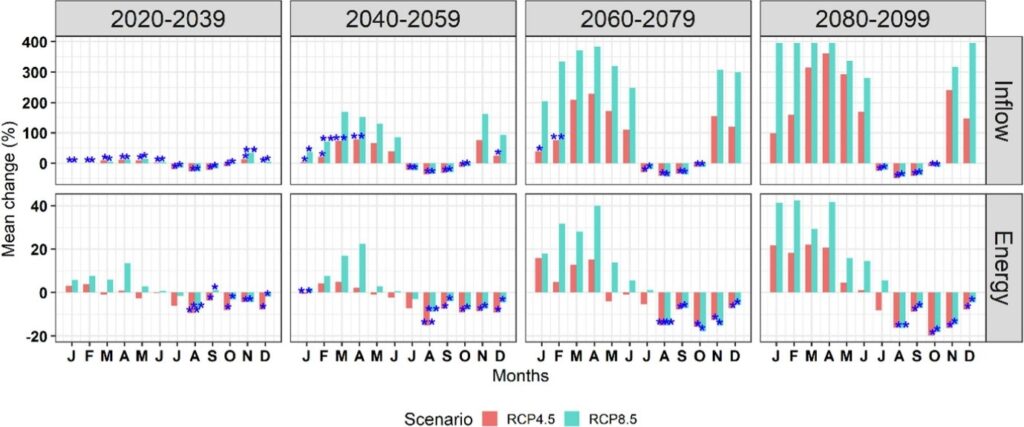
Figure 3 Monthly change of simulated inflow and energy over 2020–2099 periods relative to 1986–2005 period using climate model ensemble mean (Salomon Obahoundje, 2022)
Simulated Inflow to Hydropower Dams
The projected changes in the simulated inflow to the reservoir and energy generation are shown in boxplots comparing future periods (2020-2099) to the historical period (1986–2005). The results consistently show a decrease in both inflow and energy generation across all future periods for both RCPs. Inflow and energy generation are expected to decrease due to changing climate variables, particularly precipitation, as water availability is largely dependent on rainfall.
The percentage change in simulated inflow and energy generation is significant at the 99% confidence level for most future periods, except during 2040–2059 for RCP4.5, where the change is not significant. For inflow, reductions ranging from 2.5% to 22.5% are projected, with the largest reductions occurring in the earlier future periods (2020–2039 and 2040–2059). For energy generation, reductions range from 1% to 8%, with the largest reduction expected in the 2060–2079 period for RCP8.5 and the 2080–2099 period for RCP4.5. This decrease is likely due to the increase in temperature, which could lead to higher evapotranspiration and reduced water availability, despite the increase in precipitation. The analysis shows that the projected decreases in inflow and energy generation will worsen as the climate warms.
On the seasonal scale, significant changes in inflow and energy generation were observed. These changes were most notable in the June-July-August (JJA) and September-October-November (SON) seasons, where both inflow and energy generation were projected to decrease during the near-future (2020-2039, 2040-2059) and far-future (2060-2079, 2080-2099) periods under both RCPs. The decrease in inflow and energy generation during the dry seasons is consistent with the projected changes in precipitation.
However, some increases were observed in December-January-February (DJF) and March-April-May (MAM), particularly for inflow and energy generation in the near future. These increases were more significant for the flow than for the generation of energy, possibly due to rising temperatures and the increasing demand of water for thermal comfort, which may counterbalance some of the negative effects of changing precipitation.
The results suggest that, overall, energy generation from the Nangbeto hydropower station will likely decrease, with an accelerating decline over the coming decades. This will present challenges for meeting future energy demands and highlight the need for adaptive management strategies to ensure the long-term viability of hydropower in the region.
Key Takeaways
The results indicate that climate change will have a substantial impact on both hydropower generation and the flow to the Nangbeto dam. Although precipitation is projected to increase in the future, this will be offset by rising temperatures, which will increase evapotranspiration and reduce water availability. As a result, both the flow and the generation of energy are expected to decline, particularly in the coming decades. These findings underscore the need for decision makers to consider the impacts of climate change when planning future hydropower power production and energy needs in the region.
Discussion
The results indicate significant impacts on hydropower due to climate change, not only through increased seasonal fluctuations but also through a general decrease in hydropower generation by up to 8%. Water inflows are projected to decrease by over 22%. While monthly estimates show lower confidence, the annual projections based on RCP4.5 and RCP8.5 scenarios demonstrate 99% confidence. These projections account for both temperature increases and climate change mitigation efforts, offering a robust understanding of potential future changes.
Although modelling under RCP4.5 and RCP8.5 until 2099 aligns with current best practices, incorporating additional scenarios could provide a more comprehensive view of potential climate futures, particularly in the context of diverse policy and technological change narratives central to IPBES. Including a lower-emissions pathway, such as RCP2.6, which assumes more aggressive climate mitigation efforts, would allow exploration of a future with more rapid decarbonization and its effects on hydropower generation. Transitional scenarios—reflecting gradual shifts to cleaner energy technologies—could offer a broader set of projections, accounting for a wide range of policy responses and mitigating uncertainties in global mitigation strategies. These expanded pathways would not only enhance the robustness of the study but also provide policymakers with critical insights to navigate uncertain future conditions.
Additionally, including a broader range of scenarios directly addresses the uncertainties inherent in global and regional climate responses, aligning with the IPBES emphasis on considering multiple trajectories for guiding adaptive management and sustainable development.
The delta change method for bias adjustment assumes a consistent bias over time between observed and modelled data. However, this assumption may not always hold, particularly under shifting baseline conditions. This uncertainty in the bias adjustment process is a key consideration, as IPBES stresses addressing model uncertainty to improve the credibility of projections. While the delta change method is effective, especially in regions with stable climate patterns, it could be enhanced by alternative methods, such as quantile mapping or empirical-statistical downscaling, to further reduce bias and increase the reliability of projections.
Importantly, the impacts of reduced hydropower generation are not isolated. Hydropower is deeply interwoven with the broader water–energy–food–health–climate nexus. A reduction in hydropower generation and water availability has cascading effects across multiple sectors. For example, reduced hydropower availability directly threatens energy security—many regions, including West Africa, rely heavily on hydropower for electricity. As hydropower output decreases, dependence on fossil fuels or costly and unsustainable alternatives may rise, raising both costs and environmental concerns. This could also hinder progress towards clean energy transitions, undermining climate mitigation efforts.
Moreover, reduced water availability could heighten competition for water resources, particularly for agriculture, which depends on stable water supplies for irrigation. Analysing the output of hydropower is a potential sign of such a water shortage. A drop in water inflows could jeopardize food security by impacting crop yields, especially in regions reliant on hydropower reservoirs for irrigation. This could lead to water stress, further exacerbating water scarcity and impacting public health outcomes, particularly in densely populated regions.
On a health level, reduced hydropower generation may affect energy supply to health facilities, especially in remote areas, compromising essential services such as medical equipment, vaccine refrigeration, and other critical health operations. Reduced water availability could also harm sanitation and access to clean water, worsening public health risks.
These interconnected impacts highlight the complexity of climate change’s effects on hydropower. Decreased hydropower generation cannot be viewed in isolation—it’s a central issue that reverberates across the water, energy, agriculture, and health sectors, creating a feedback loop of negative consequences. Addressing these challenges requires integrated adaptation strategies that consider the synergies and trade-offs between these sectors.
For instance, integrated water resource management (IWRM) strategies are crucial for balancing the competing needs of energy production, agriculture, and drinking water. A holistic approach to hydropower planning should incorporate climate projections, water availability, and food security concerns to ensure policies remain resilient to uncertainties and future climate shocks. This may include diversifying the energy mix, improving water storage and distribution systems, and promoting agricultural practices resilient to climate changes.
Furthermore, climate-smart agriculture and demand-side energy management can help mitigate the impacts of reduced hydropower. Improving irrigation efficiency or shifting to drought-resistant crops could reduce agricultural vulnerability to water scarcity, while energy demand management can ease the pressure on the grid during peak dry seasons when hydropower generation is lower.
Limitations
While the projections presented provide valuable insights into climate impacts on hydropower, a comprehensive exploration of associated uncertainties is crucial. Three primary sources of uncertainty are notable:
- Data Uncertainty:
Observational datasets such as CHIRPS and GMFD, although validated, inherently contain measurement errors and spatial resolution limitations. Errors in observed precipitation or temperature can propagate through bias correction processes, affecting model projections.
- Model Structural Uncertainty:
The ensemble machine learning approach reduces structural uncertainty by combining multiple models; however, each model has its inherent assumptions and limitations. Differences in model sensitivities to lagged climate variables, for instance, can influence forecast variability.
- Scenario Selection Uncertainty:
Using only RCP4.5 and RCP8.5 scenarios provides a limited view of possible futures. Excluding additional scenarios restricts understanding of how policy decisions might alter projected impacts.
These uncertainties propagate through the modelling chain, influencing the confidence levels of projections. The ensemble spread, reflecting variability across model outputs, captures some aspects of this uncertainty but may not encompass all potential biases. Clearly communicating these uncertainties, as emphasized by IPBES guidelines, is essential for accurate interpretation by policymakers and stakeholders.
Conclusion
Ultimately, the projected decrease in hydropower generation underscores the need for coordinated responses across sectors. Policymakers must recognize the importance of adaptive management strategies capable of addressing both immediate and long-term climate impacts. These strategies should aim not only to maintain energy production but also to safeguard the sustainable management of water resources and protect the livelihoods of communities reliant on these essential systems. To mitigate the compounded effects of climate change, these strategies should be implemented alongside investments in alternative energy sources such as solar and wind, helping to diversify energy generation and enhance energy security. Nexus governance, which integrates water, energy, food, and health systems, should guide decision-making, ensuring coordinated responses across sectors and fostering long-term climate resilience.
References
- H.-O. Pörtner, D. R. (2019). Summary for Policymakers. In: IPCC Special Report on the Ocean and Cryosphere in a Changing Climate. IPCC.
- O’Brien, K. G. (2024). Thematic Assessment Report on the Underlying Causes of Biodiversity Loss and the Determinants of Transformative Change and Options for Achieving the 2050 Vision for Biodiversity of the Intergovernmental Science-Policy Platform on Biodiversity and Ecosyste. IPBES secretariat. doi:https://doi.org/10.5281/zenodo.11382215
- Obahoundje, S. a. (2022). Potential impacts of climate, land use and land cover changes on hydropower generation in West Africa: a review. Environmental Research Letters.
- Salomon Obahoundje, A. D. (2022). Modeling climate change impact on inflow and hydropower generation of Nangbeto dam in West Africa using multi-model CORDEX ensemble and ensemble machine learning. Applied Energy. doi:https://doi.org/10.1016/j.apenergy.2022.119795.
Author